Usage
Installation
To use SwingTrend, first install it using pip:
$ pip install swingtrend
Swing class requires atleast 40 candles (Recommended 60 candles) to get an accurate reading of the trend.
Examples
For conciseness, only the relevant bits of code have been shown.
Basic example
from swingtrend import Swing

swing = Swing(retrace_threshold_pct=5)

swing.run(sym="HDFCBANK", df=df.iloc[-60:])

print(f"{swing.symbol} - {swing.trend}")

if swing.trend == "UP":
    print(f"SPH: {swing.sph}, {swing.sph_dt:%d %b %Y}")
    print(f"CoCh: {swing.coc}, {swing.coc_dt:%d %b %Y}")
elif swing.trend == "DOWN":
    print(f"SPL: {swing.spl}, {swing.spl_dt:%d %b %Y}")
    print(f"CoCh: {swing.coc}, {swing.coc_dt:%d %b %Y}")

swing.is_sideways # bool True or False

# Are enough candles present to accurately determine trend?
swing.is_trend_stable # bool True or False

swing.reset()
Screening stocks
for sym in watchlist:
 swing.run(sym=sym.upper(), df=df.iloc[-60:])

 if swing.trend == "UP" and swing.bars_since > 4 and swing.bars_since < 15:
     # Stocks in uptrend with a pullback between 4 and 15 bars.
     print(sym)

 swing.reset() # Dont forget to reset after each iteration.
Attaching callback functions
Here we look for stocks which have reversed to uptrend or broken above the SPH.
The stocks are collected into a list and printed at the end.
 breakout_lst = []
 reversal_lst = []

 # The two functions below will be attached to the Swing class
 def bos(swing: Swing, date, close, breakout_level):
    if date != swing.df.index[-1]:
        # We only want stocks for today and not previous dates.
        return

    if swing.trend == "UP" and swing.is_trend_stable:
        breakout_lst.append(swing.symbol)

        print(
            f"{date:%d %b %Y}: {swing.symbol} break @ {breakout_level} with close @ {close}"
        )

 def reversal(swing: Swing, date, close, reversal_level):
    if date != swing.df.index[-1]:
        return

    # Trend was down and now reversed to UP
    if swing.trend == "UP" and swing.is_trend_stable:
        breakout_lst.append(swing.symbol)

        print(
            f"{date:%d %b %Y}: {swing.symbol} reversed @ {reversal_level} with close @ {close}"
        )

 swing = Swing()

 # Attach the functions to Swing class
 swing.on_breakout = bos
 swing.on_reversal = reversal

 for sym in watchlist:
    swing.run(sym=sym.upper(), df=df.iloc[-60:])
    swing.reset()

if breakout_lst:
    print("Breakouts", breakout_lst)

if reversal_lst:
    print("Reversals", reversal_lst)
Plot with mplfinance
import mplfinance as mpf
from swingtrend import Swing

swing = Swing(retrace_threshold_pct=8)

# add `plot_lines=True`
# here we pass additional candles since it takes 40 candles to confirm the trend.
swing.run(sym, df.iloc[-160:], plot_lines=True)

# `swing.plot_lines` provides the line coordinates
# `swing.plot_colors` provides the line colors
# Add the lines and colors to alines
mpf.plot(
    df,
    title=f"{sym.upper()} {swing.trend}",
    type="candle",
    style="tradingview",
    scale_padding=dict(left=0.05, right=0.6, top=0.35, bottom=0.7),
    alines=dict(
        linewidths=0.8,
        alpha=0.7,
        colors=swing.plot_colors,
        alines=swing.plot_lines,
    ),
)
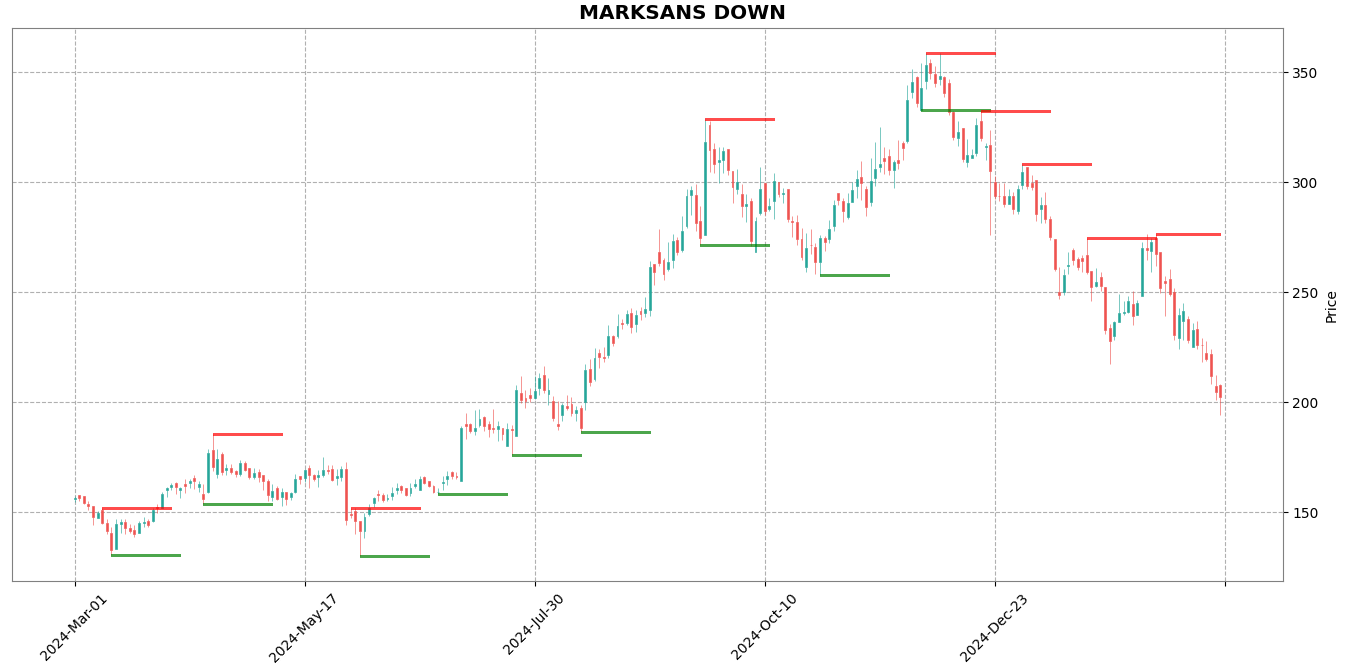
In the chart, green lines indicate the CoCh levels in uptrend. Red line represent CoCh levels in downtrend.
Using Swing.identify
Pandas is not a requirement. You can provide OHLC data from any source to Swing.identify.
You can also pass OHLC data generated from websocket feeds for real-time trend identification.
ohlc_tuple = (
  (datetime(2024, 1, 1), 100, 90, 93),
  (datetime(2024, 1, 2), 95, 85, 88),
  (datetime(2024, 1, 3), 90, 80, 83),
  (datetime(2024, 1, 4), 85, 75, 78),
)

swing = Swing()

for tup in ohlc_tuple:
    swing.identify(*tup)
Debug Mode
Debug mode is useful when trying to understand the program. Have a chart in front and read the logs.
import logging
from swingtrend import Swing

# Make sure to set basicConfig for logging
logging.basicConfig(format="%(levelname)s: %(message)s", level=logging.WARNING)

swing = Swing(debug=True)

# DEBUG: 2024-12-09 00:00:00: First Candle: High 377.45 Low: 370.1
# DEBUG: 2024-12-10 00:00:00: Start Trend: UP High: 383.4
# DEBUG: 2024-12-11 00:00:00: New High: 388.65
# DEBUG: 2024-12-12 00:00:00: New High: 391.5
# DEBUG: 2024-12-13 00:00:00: Swing High - UP SPH: 391.5 CoCh: 370.1
# DEBUG: 2024-12-17 00:00:00: Reversal DOWN Low: 363.25 CoCh: 391.5
# DEBUG: 2024-12-18 00:00:00: New Low: 362.3
# DEBUG: 2024-12-19 00:00:00: New Low: 358.6
# DEBUG: 2024-12-20 00:00:00: New Low: 355.2
# DEBUG: 2024-12-23 00:00:00: New Low: 346.45
# DEBUG: 2024-12-24 00:00:00: Swing Low - DOWN SPL: 346.45 CoCh: 391.5
Adding a series to Pandas DataFrame
Set add_series argument in swing.run to True. This is useful for backtesting historical data.
The first 40 candles will be None, since the trend is not fully confirmed till then.
swing = Swing()

swing.run(sym=sym.upper(), df=df, add_series=True)

print(df)

#               Open    High     Low   Close   Volume TREND IS_SIDEWAYS
# Date
# 2024-07-15  250.81  255.00  242.76  252.98  2601155  None        None
# 2024-07-16  252.80  256.50  247.00  254.01  3210967  None        None
# 2024-07-18  250.00  258.00  244.00  245.16  3355053  None        None
# 2024-07-19  248.00  258.59  241.60  244.69  8460052  None        None
# 2024-07-22  244.50  249.39  240.81  244.57  2066923  None        None
# ...            ...     ...     ...     ...      ...   ...         ...
# 2025-02-24  364.00  364.00  355.20  360.25  1305661     0           0
# 2025-02-25  358.00  365.35  352.00  354.05  2113683     0           0
# 2025-02-27  357.00  362.95  347.60  356.75  1797225     0           1
# 2025-02-28  353.00  355.40  340.00  346.00  2773439     0           1
# 2025-03-03  342.50  356.95  327.85  352.10  2583375     0           1
#
# [160 rows x 7 columns]